Using your existing devices for phish-proof MFA in Okta

IT and security professionals: you are free to copy and modify this content however you’d like without attribution. I encourage the reuse of this content for your own internal documentation or guides.

In this post, I’ll start by providing instructions for using Touch ID, Face ID, or your phone PIN code as the MFA for your Okta account, and then wrap up with a brief explanation of why this form of MFA is unbreakable.

Step-by-step

For starters, this only works on Safari or Chrome/Chromium-based browsers (such as Brave). Sorry Firefox users, there’s no support quite yet, but it’s hopefully Mozilla will add it soon. Second, you must already have Touch ID, Face ID, or a lock screen PIN configured on your device. Here’s Apple’s guide for setting up Touch ID on your MacBook.

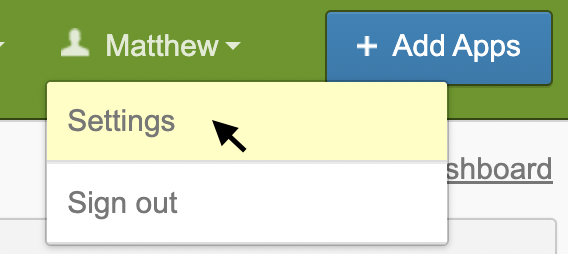
  • Using the device you plan to authorize as one of your trusted devices (e.g. your phone or laptop), sign in to Okta and select your name in the top-right corner. Choose ‘Settings’.
  • Click the ‘Edit Profile’ button on the top-right corner. You will likely be challenged to enter credentials again.
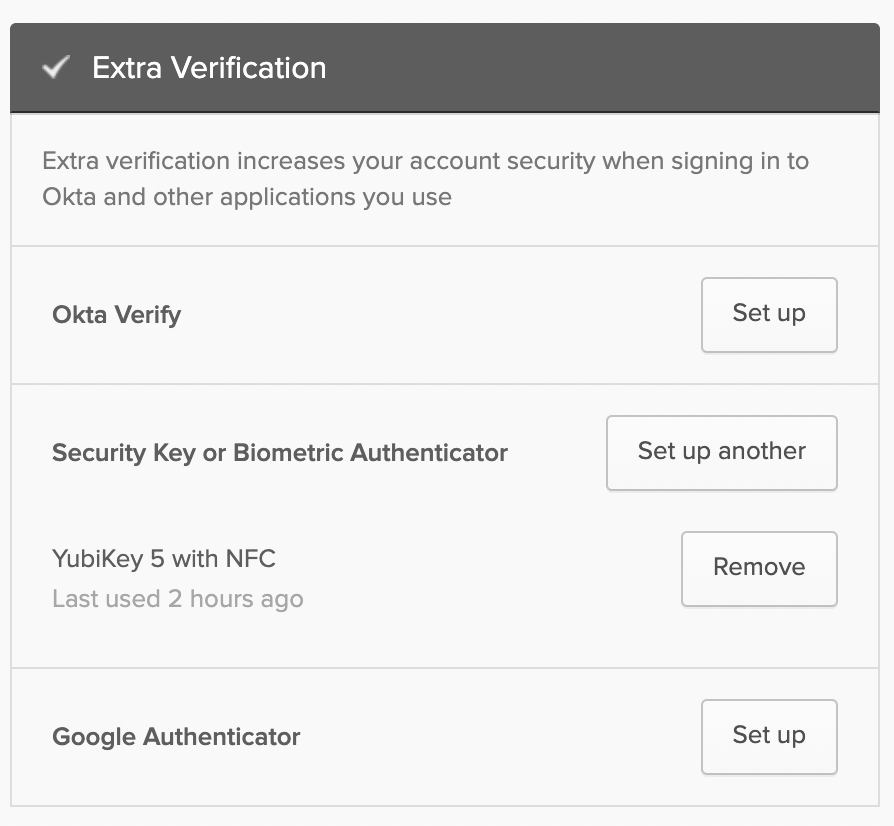
  • Scroll down until you find ‘Extra Verification’ section on the right side of the page. Select the ‘Set up’ or ‘Set up another’ option under ‘Security Key or Biometric Authenticator’.
  • You will be taken to the MFA enrollment page, and it may look different to you depending on if you already have strong MFA devices configured. Select ‘Set up’ or ‘Set up another’.
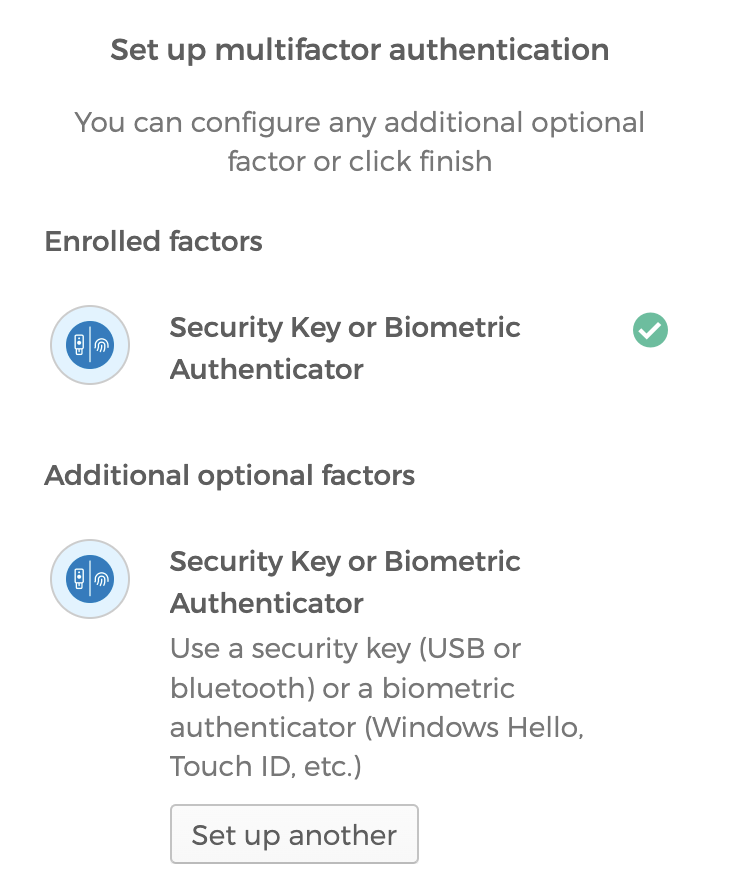
  • On the next page, click the ‘Enroll’ button.

    💻 For setting up a new factor with your MacBook:
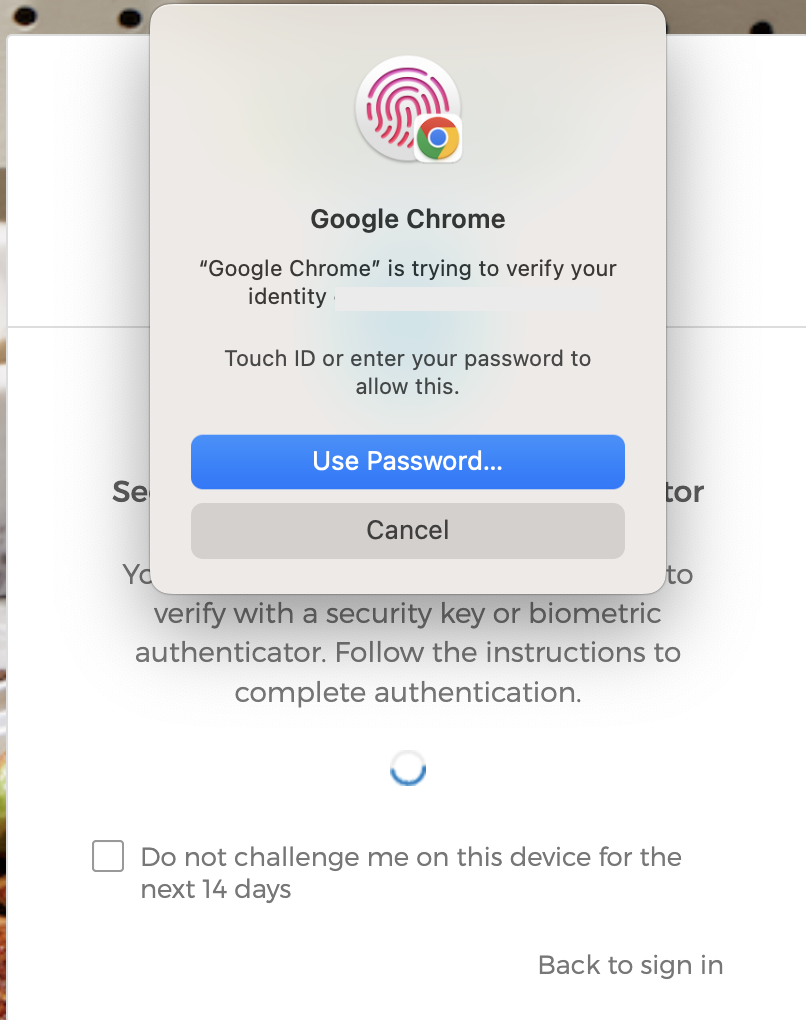
    Chrome will prompt you asking which device you’ll be utilizing for MFA. Select ‘This device’. You will then be prompted to press your finger to your Touch ID reader.


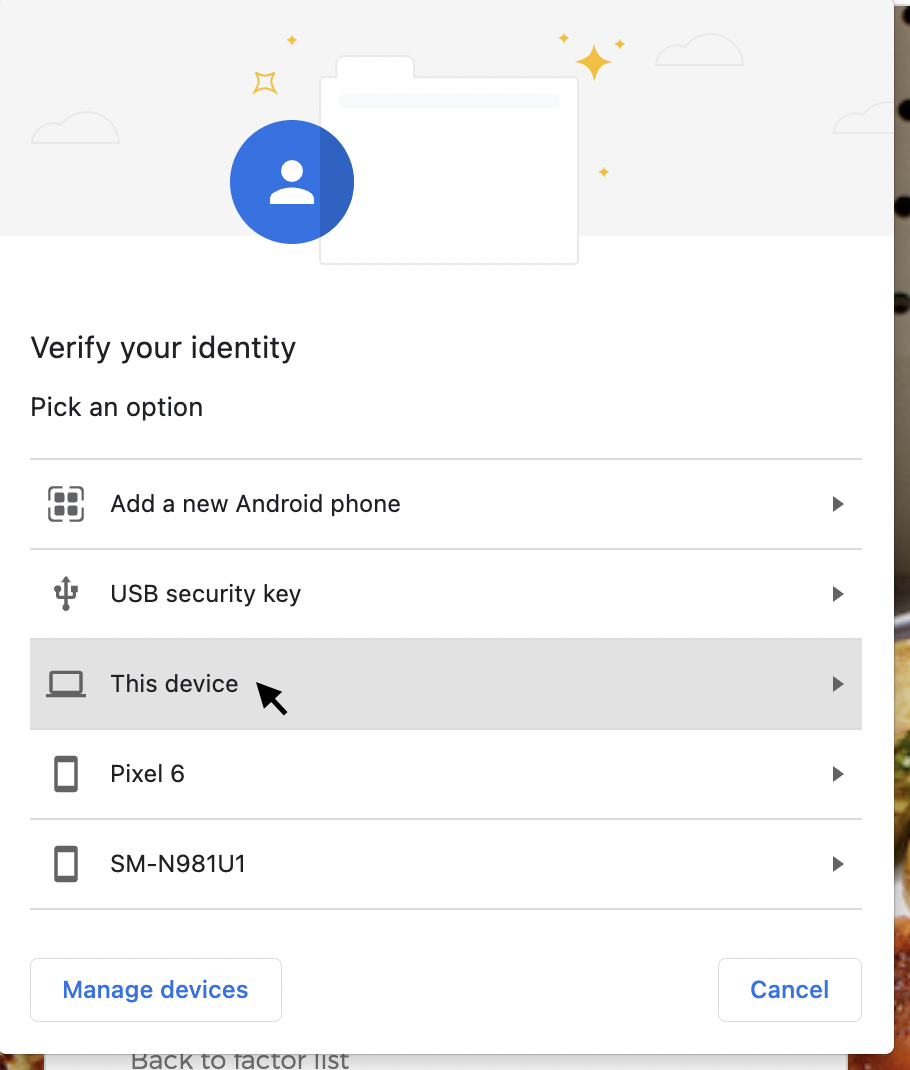
    For setting up a new factor with your iPhone or iPad
    Your iOS device will ask you to verify your Face ID or Touch ID, just as you would to unlock your phone.


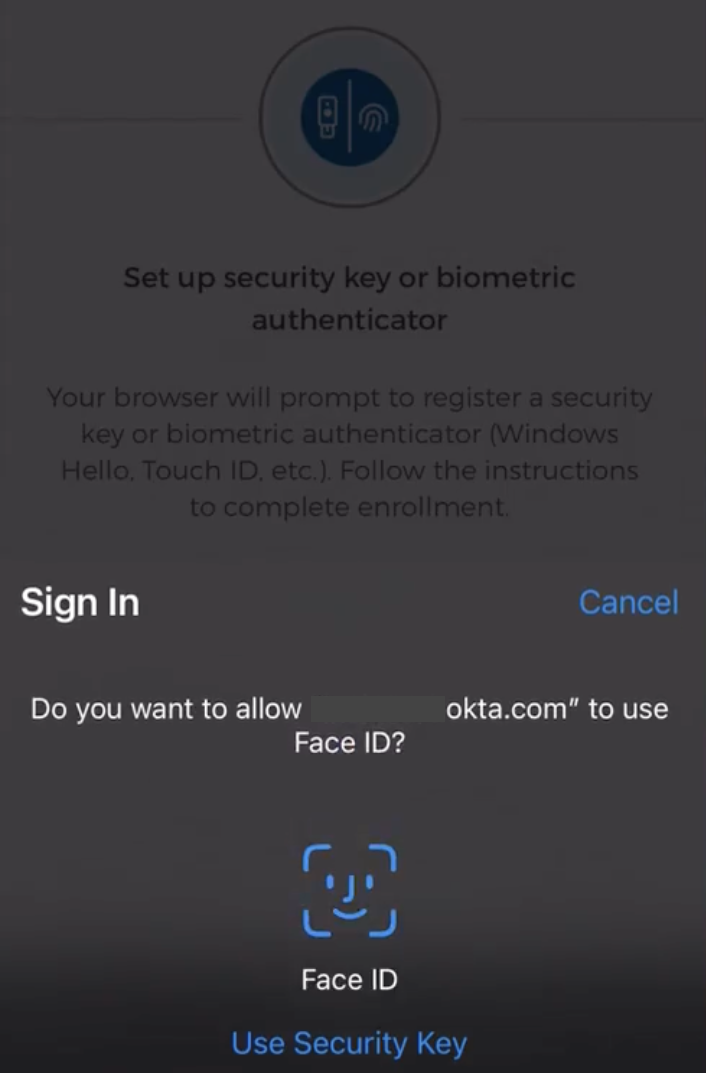
    🤖 For setting up a new factor with your Android
    Select ‘Use this device with screen lock’ to utilize your phone’s unlock screen as your MFA method. Depending on your phone’s configuration, unlocking with fingerprint or face matching may also be available options, and these are acceptable as well.
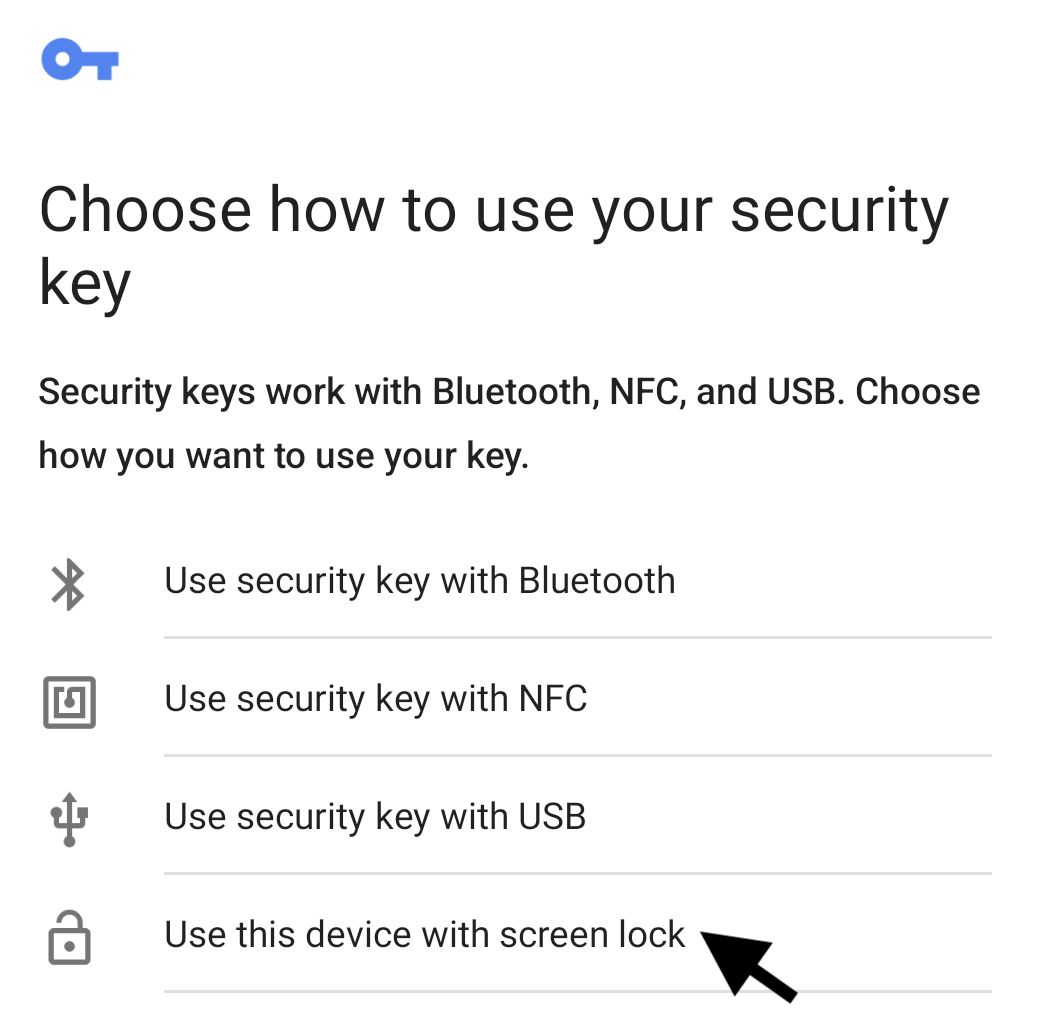
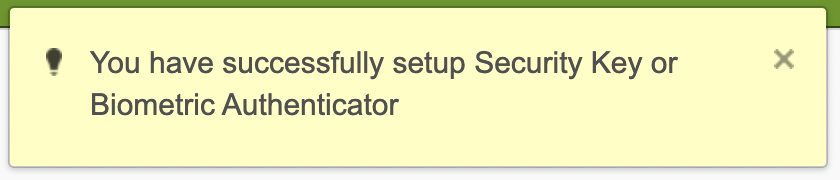
  • After enrolling your device, you will be returned to your Okta settings page. You should receive a success confirmation.
  • For all subsequent logins, Okta should automatically prompt you to verify with Touch ID, Face ID, or your phone’s PIN.
  • If Okta prompts you for some other MFA method, you may need to manually select the proper option, ‘Security Key or Biometric Authenticator’.

That’s it, you’re all set! Log out of Okta and attempt to log back in, just to ensure everything is set up and working well.

Now, I would also recommend you go and purchase an unphishable authenticator for personal use, and then utilize that as your backup option for your work account. This will also allow you to get logged in from a new mobile device without having to contact your IT department to get your MFA reset.

My personal recommendation is the YubiKey 5C NFC (Amazon, $55 USD)†, which can not only plug in to your Mac if Touch ID fails you, but can also be used from your phone thanks to NFC (NFC is the technology that allows you to tap to pay). I will disclaim that the NFC part can be fickle, so you’ll need to practice and find the right spot on your phone where the scan will work consistently.

It’s worth repeating: you should be using an unphishable MFA device for your high-impact personal accounts. So consider the purchase of a USB device as nice two-for-one; you get to protect your personal accounts, and you get to ensure you don’t get stuck locked out of your work account if you need to get on from a new device.

Set up your backup by going back to this step and selecting ‘USB security key’, then inserting your YubiKey or similar device. Once you have Touch ID, Face ID, or phone PIN and a USB backup configured, don’t forget to go back into your Settings and remove any unsafe MFA methods you previously had configured (such as SMS, Okta Verify, or Google Authenticator).

† And no, I am not getting a commission or paid in any way if you buy one of those from the link above. I just care about you and your safety 🙂

Why is this important?

The Problem

This was a tough summer for security professionals. The writing has been on the wall for some time, but it’s now clear from large-scale and high-impact compromises of major tech companies that most forms of multifactor authentication (MFA) are not going to be sufficient to stop today’s unskilled attackers, let alone the highly talented ones. Tech news outlets have even covered how entire toolkits are available in criminal marketplaces for just a few hundred U.S. dollars.

In short, attackers are now either:

  • Collecting MFA codes and simply forwarding them to the service they wish to break into while the code is still valid.
  • Sending push notifications to apps like Okta Verify or OneLogin Protect over and over, until the target simply gives in and hits approve.

The Solution

These new, OS-native MFA solutions like Touch ID, Face ID, or phone PIN are all utilizing a new standard for authentication called Webauthn. There’s plenty of information already written on the standard, but in short: Webauthn ties an authenticator (like Touch ID) to a specific website, and does so in a way that is invisible to the user. There’s no ability to trick a user into, for example, reading an MFA code over the phone to an attacker. If a victim is phished and isn’t actually at the real Okta, their browser will not provide the right information to complete the Webauthn challenge. Webauthn is phish-proof!

Getting your money’s worth: making runtime logging more valuable

“Get your money’s worth”

I like this phrase. I hadn’t really stopped to think about it until I wrote this blog post. I unpack it as:

“Get the amount of value you expect to receive for the cost.”

Today I want to write about something that I’ve been thinking about for a long time. Companies spend a lot of money on our logs. A lot. Whether you pay per gigabyte processed, or stored, or queried, there exists the universal truth that somehow, despite it being 2022, simply collecting or utilizing logs can be one of the most costly infrastructure tasks out there.

Regardless of how you process or store your logs, the important question is this:
Do you get the amount of value you expect for the cost?

$2,000 USD (2,631 CAD / 2.023 EUR)

This is the average amount a previous employer of mine spent each day on collecting and retaining runtime logs back when I ran the numbers many years ago. Historically, those expenses basically doubled each year, so by now it’s probably much, much higher.

While we did have a serious quantity-of-unhelpful-logs problem that we later addressed, I’m not going to focus on reducing costs at all in this blog post. Instead, I want us to focus on the value we are getting from existing logging. I want us to get our $2,000’s worth each day. Let’s find out how we can!

Avoid formatting variables into your log message

How you usually do it

logging.info("User's favorite ice cream is %s." % flavor)

Imagine someone walks up to you and says,

Can you go into Splunk and chart, over time, the preferences in flavor of our users?

You think for a moment about this, and decide the easiest way to pull this information out of your log messages is to use a regex match in your Splunk search.

| rex field=message "^User's favorite ice cream is (?<flavor>.*).$"

That’s not the worst solution, but it’s also not particularly clean. Now imagine that you log a lot more data than just flavor:

logging.info('{} from company {}, favorite ice cream is {}, referral source is {}.'.format(username, company, flavor, channel))

Your Splunk search to pull out these items now needs regular expressions and looks like this:
| rex field=message "^(?<username>[^\s]+) from company (?<company>.*), favorite ice cream is (?<flavor>.*), referral source is (?<channel>.*)$"

Gross

How you should be doing it

Pretty much all logging solutions support hydrating metadata properties on each log event with as many fields as you’d like. The implementation is language-specific, but the here’s the Python example:

context = {'flavor': flavor}
logging.info("User's favorite ice cream recorded.", extra=context)

Some languages can natively output JSON from their loggers. Others, like Python, need a library to do it. In any case, research what it takes to log JSON and push the resulting output to your logging tool of choice.

Now that we’ve utilized the extra dictionary in the above example, set up JSON log output, and set up ingestion of those logs, let’s take a look at the results in Splunk:

{
         level: info
         message: "User's favorite ice cream recorded."
         metadata:
         {
             func: create_or_update_preference
             lineno: 45
             flavor: "vanilla"
         }
         timestamp:      2022-06-14T20:57:32.330888Z
         type: log
         version: 2.0.0
}

Now it is much easier to utilize the metadata in Splunk. Let’s find the distinct number of users who have a favorite flavor other than vanilla, and report the results back by flavor:
metadata.flavor!=vanilla | stats dc(message) by metadata.flavor

dc(message)metadata.flavor
6chocolate
2mint
4cherry

Obviously the above examples are Python-specific, but Golang has several libraries for structured logging, such as the very popular Logrus and Java has these features built-in using the MDC. A google search like “structured logging ruby” should get you started no matter what language you are using.

Avoid dumping object representations straight to logs

One of the things that greatly increases log volume without increasing their value is the dumping of objects directly into the message field.

logging.debug("Found matching user: %s" % str(user))

>>> Found matching user: User{details=Details{requestId=1387225,
usertype=1, accountId=QWNjb3bnRvIGh1bWFuLXJlYWRhYm,
organizationId=QWNjb3vcm1hdC4KCkJhc2U2NCBlbmNvZGl,
solutionType=QWNjb3b1tb25seSB1c2VkIHdoZW4gdGh},
firstName=Matthew, lastName=Sullivan}

Something roughly similar to the log above was sent through our logging pipeline millions of times per day in production. We can assume that this log data helped the product team debug production issues, but with such a large volume of unparsed data, narrowing down on a specific user or organization would be extraordinarily difficult, and Splunk search performance is impacted substantially because of the large message field size. Additionally, producing a report or creating a scheduled alert will require some significant regular expression work.

Avoid using log data as performance telemetry

We utilized a number of services for collecting metrics around application performance. Sometimes, developers were also sending timing/tracing and telemetry-type data through the runtime logging pipeline. This was problematic because that data should clearly have been going to a purpose-built tool for it, such as New Relic or Datadog.

logging.info("Query ran for a total of %d ms" % query_time)
>>> Query ran for a total of 43 ms

The log above was sent through the pipeline tens of millions of times per day in production. While Splunk has a number of very powerful visualization tools, teams needed to be using a tool more suited to this type of mass data collection and visualization. If you really must log this type of data, consider sending only a small representative sample:

LOG_SAMPLE_RATE = 0.01 # 1%
def sample(message, level='debug', extra={}):
    # random.random() returns a float between 0.0 and 1.0
    rnd = random.random()
    if rnd > LOG_SAMPLE_RATE:
        return

    extra['sample_rate'] = LOG_SAMPLE_RATE
    getattr(logging, level)(message, extra=extra)

Even this is kind of strange and gross, so if you are going to do it, do it on a temporary basis and then eventually iterate it out of existence.

Parting thoughts

As applications and cloud workloads continue to grow in both their size and complexity, it’s critical that you have the right tools in place, and that you know how to maximize the value you can derive from those tools. Consider how you can add more value to your runtime logs in order to detect problems and glean valuable data about customer interactions with your platform. A day spent investing in log value will pay dividends to your teams, your support engineers, and your customers.

I’d like to quote something a colleague of mine mentioned while reviewing this post, which I think is a very valuable insight:

Another dimension of cost is the time it takes to diagnose an issue in production. We spend money and time on logging to reduce time (and, by extension, money) spent in the future. Good logs ensure production issues are diagnosed quickly, and that errors encountered during development are obvious. The engineering trade-off is minimizing the total number of log messages per request while maximizing visibility into execution.

Like in all application or system development, tooling will only take you so far. It’s the quality of the data going into those tools which will make the biggest impact at the end of the day. Don’t be afraid to push back on your product or project managers; it’s your job to help educate them of the value good log hygiene will provide in the long-term. Maybe share this post with them 😉